How to Measure Queue Wait Time and Abandonment at the Checkout
Checkout queue wait time measurement turns a vague complaint into a number you can act on. You already know long lines cost you baskets. What you usually do not have is a figure that says how long people are waiting, how many are giving up, and which hours are the worst. Without that, "the checkout was busy today" is the best your team can do.
This guide explains the three numbers behind every line: queue length, wait time, and service time. You will see what each means, how a single overhead camera measures them anonymously, what queue abandonment really is, and how a rising wait turns into lost sales. Everything here is measured from a camera you already own, with no facial recognition, no tracking of individuals across the store, and the video kept on-site.
Key takeaways
- Queue length, wait time, and service time are three separate numbers. Splitting wait from service tells you whether to add lanes or speed up the counter.
- A single overhead checkout camera measures all three anonymously, with no facial recognition and the video kept on-site.
- Queue abandonment is people who join the line then leave before being served. It tends to climb sharply once waits stretch past a few minutes.
- Walk-aways usually mean lost baskets, so a wait-time threshold should trigger a clear action, like opening another lane.
- Start with one camera on your busiest till, then use the history to find the recurring pressure hours.
The three numbers that explain every line
A queue feels like one problem, but it is really three measurements stacked on top of each other. Keeping them apart is what makes the data useful.
- Queue length is how many people are waiting right now. It is the number you can see at a glance, and it is the one customers notice when they decide whether to join.
- Wait time is how long a person stands in line from the moment they join to the moment they reach the counter. This is the number that drives frustration and walk-aways.
- Service time is how long the transaction itself takes once they reach the till: scanning, bagging, paying.
The reason to separate wait from service is that they point to different fixes. A long wait with a normal service time means you do not have enough lanes open for the traffic. The answer is to add a till. A normal wait with a long service time means the lanes are keeping up, but each transaction is slow. The answer is at the counter: training, a faster payment step, or a process that is holding people up.
If you only track one combined "time at checkout" figure, you cannot tell those two apart, and you will reach for the wrong fix. Opening another lane does nothing if the real problem is that each transaction takes too long. The queue feature page covers how each stage is timed.
How a camera measures the queue anonymously
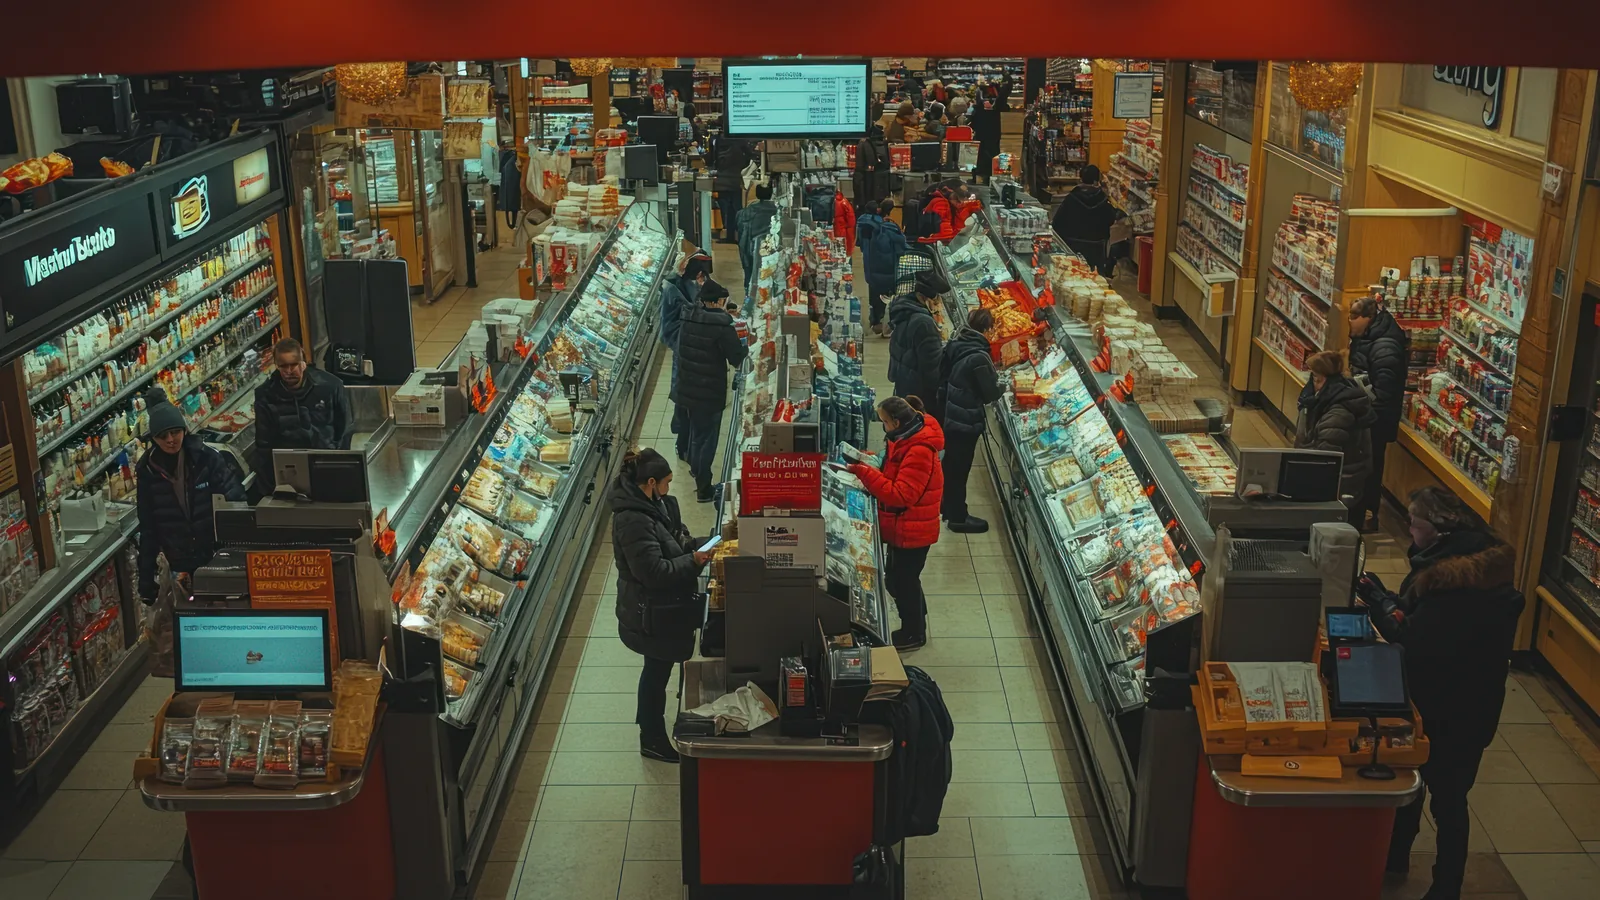
You do not need ticket dispensers, floor sensors, or an app. One overhead camera looking down on the checkout area is enough.
The system watches a defined queue zone in that view. When a person enters the zone and stands in line, they are counted into the queue. When they move forward and reach the counter, the system marks that as reaching service. The difference between those two moments is the wait time. The time spent at the counter is the service time. Both come from the same camera view, timed separately.
This is body-only detection. The system recognises the shape of a person in the frame. It does not run facial recognition, it does not identify anyone, and it does not build a profile. The video is processed on the premises, on a back-office PC, mini-PC, or supported camera, so footage does not leave the store.
One honest point about what this is and is not. The camera measures the queue area, not a specific person moving around your shop. It is not following a shopper from the entrance to the till and back. It counts how many people are in the queue zone and how long the zone takes to clear. For a deeper look at how camera queue analytics work and where they fall short, see Queue Management Without Tickets or Apps.
What queue abandonment means and how it is read
Queue abandonment is straightforward to define. It is people who join the line and then leave before being served. They were ready to buy, they waited, and at some point they decided the wait was not worth it and walked off.
It is worth being honest about how this is read. The system sees people entering the queue zone, and it sees the zone clearing. When someone leaves without reaching the counter, that is the signal behind abandonment. Treat it as an indicator of checkout pressure rather than a perfect per-person tally. In a busy, shifting line, the camera cannot certify the intent of every individual. What it can do reliably is show you when walk-aways are rising and when they are not.
The reason this matters is that abandonment is not linear. Industry studies on checkout behaviour consistently find that patience holds for the first minute or two, then drops off quickly. A customer who would happily wait two minutes may abandon at four, and far more abandon at six. The exact numbers vary by store, basket size, and how much of a hurry people are in, but the shape is the same everywhere: a sharp climb once the wait gets long.
So a rising abandonment signal has a clear meaning. It tells you the wait has crossed the line where people start giving up, and the response is usually simple: open another lane or move a colleague to a second till before more baskets walk out.
How wait time turns into lost baskets
The logic from wait time to lost revenue is short. People who abandon the line rarely come back later. They leave the basket behind and walk out, and a walk-away is a lost sale.
Here is a clearly illustrative example to show the method. Suppose a store handles 500 checkout visitors on a busy day, and during the peak hour the wait climbs high enough that a measured share of people walk away. If even 3 percent of the day's traffic abandons, that is 15 lost baskets. These are not CountPort's guaranteed figures. They are placeholders so you can run the same sum on your own data.
To estimate the value at stake, multiply your own walk-away count by your average basket. If your average basket is 40 dollars and you lose 15 baskets, that is 600 dollars in a single day, concentrated in a handful of peak hours rather than spread evenly. Across a month of busy days, the number gets serious quickly.
The encouraging part is that the fix is operational, not technical. You do not need a new sensor or a store rebuild. You need to know when the wait crosses the danger line so a manager can open a lane in time. The camera supplies the signal, and the action is the same one good supervisors already take, just triggered earlier and on evidence instead of a glance.
Setting thresholds that trigger action
A measurement only earns its keep when it sets off an action. For queues, that means picking a wait-time threshold and wiring it to a clear response.
Start by choosing a threshold that fits your store and your customers. A grocery run and a considered furniture purchase tolerate very different waits. A reasonable starting point for many stores is three to four minutes, then tighten or loosen it once you see how your customers behave. The right number is the one that catches the queue before walk-aways begin.
Connect that threshold to an alert and a named response. When the wait crosses the line, the alert can route to a manager's phone or a screen at the service desk, and someone owns the next step: calling a colleague to a second till, or opening a lane. An alert with no owner gets ignored, so decide in advance who acts on it.
Watch service time on its own as well. If waits are fine but service time is creeping up at one till, that is a counter problem, not a staffing one: a training gap, a slow payment terminal, or a process step holding people up. The split between wait and service is exactly what lets you tell those apart.
Finally, review the queue history rather than only the live screen. Over a week or two, a pattern shows up: the same pressure hours, the same days. Once you know the recurring crunch is Saturday from 11 to 1, for example, you can plan for it instead of reacting to it. Matching cover to those hours is the subject of Staffing to Footfall.
Getting started on your busiest checkout
You do not need to wire up the whole store to get value. Start with one camera on your busiest till.
That single view shows you the wait-time pattern, the service-time pattern, and the hours when abandonment climbs. It is usually enough to justify the first staffing change and to give you a clean before-and-after once you act on it. When you are confident in the numbers, add the next checkout.
It runs as software on-site using your existing IP cameras over RTSP or ONVIF. There is no new hardware to buy and no rip-and-replace, and the footage stays on the premises. If you have a camera over the checkout already, you may be most of the way there.
Pricing is flat per camera, so the cost of starting with one till is easy to work out and easy to scale. The per-camera rates are on the pricing page. The same approach applies wherever lines form, from a supermarket front end to a restaurant or quick-service counter.
Frequently asked questions
How is checkout queue wait time measured with a camera?
CountPort uses one overhead camera over the checkout to detect when people join the line and when they reach the counter, then times the gap. It does this anonymously, with no facial recognition, and processes the video on-site.
What is queue abandonment rate?
It is the share of people who join a line but leave before being served. Treat it as a useful signal of checkout pressure rather than an exact tally, and expect it to rise quickly once waits stretch past a few minutes.
What is the difference between wait time and service time?
Wait time is how long a customer stands in line before reaching the counter. Service time is how long the transaction takes once they get there. Measuring them separately tells you whether to open more lanes or fix the service itself.
Can camera queue analytics tell me how much money long lines cost?
Not exactly, but you can estimate it. Combine the measured walk-away signal with your own average basket value to gauge the revenue at stake, then act on the wait-time threshold that drives the walk-aways.
See it on your own checkout
The fastest way to know what your lines are costing is to measure your own busiest till. To see queue length, wait time, and service time on your own checkout footage, request a demo and we will walk through it with you. For the wider picture of how occupancy and queue fit together, start with the Real-Time Occupancy and Queue Management guide.