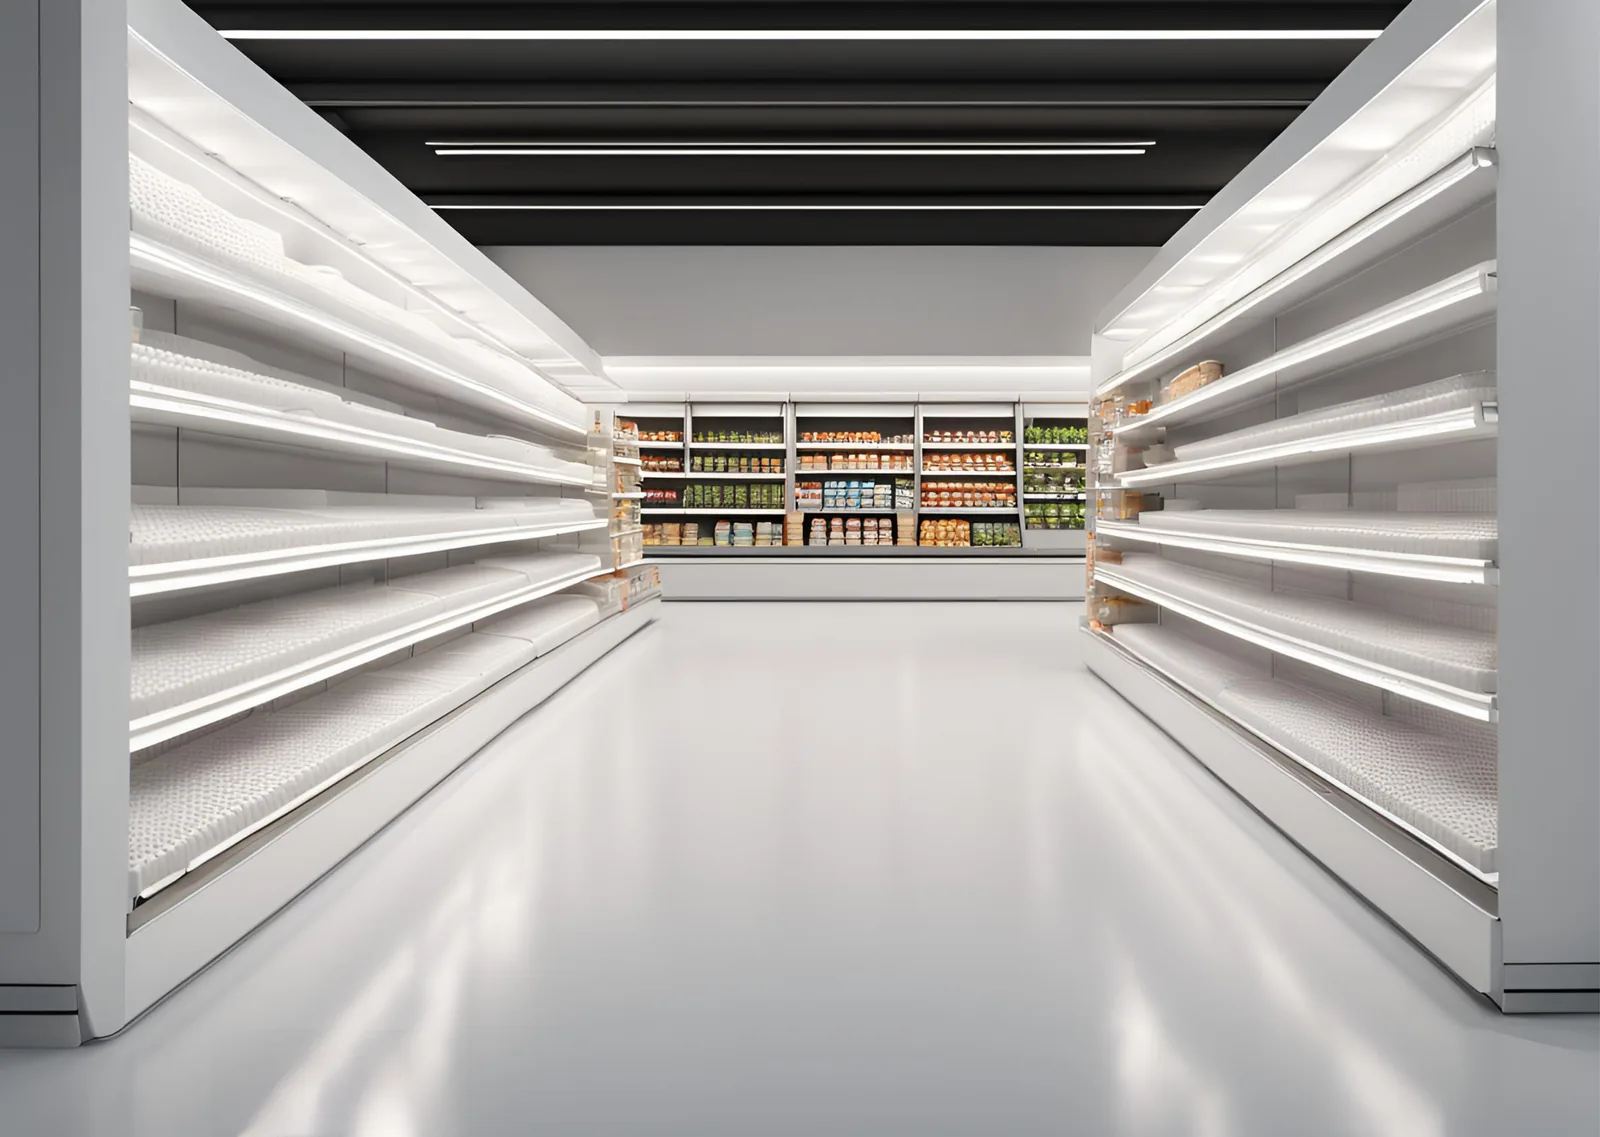
People Counting and Visitor Analytics for Supermarkets
CountPort turns the overhead cameras a grocery store already runs into footfall, queue and aisle analytics. Video is processed on-site, and only anonymous numbers reach the dashboard.
Works with the cameras you already have · Anonymous · Video stays on-site
Footfall analytics built for the rhythm of a grocery store
People counting for supermarkets answers questions that store managers face every day. How many shoppers entered before the evening peak, how long the checkout queue grew, and which aisles carried the most traffic. CountPort measures these patterns using the overhead cameras a grocery store already owns, so there is no new hardware to install and no separate sensor network to maintain.
Grocery operations run on thin margins and tight labour budgets, which makes accurate footfall the foundation of good decisions. CountPort produces supermarket visitor counting figures that exclude staff, separate adults from children, and record group arrivals as the correct number of people. From those counts, the platform reports occupancy, checkout queue length, aisle traffic and the movement of shoppers across the floor, all without identifying anyone.
Every figure CountPort reports is anonymous by design. Camera feeds are processed on a small computer inside the store, the video never leaves the building, and the dashboard receives only the resulting numbers. CountPort does not use facial recognition and does not identify individuals, which keeps grocery footfall analytics defensible for shoppers, staff and head office alike.
What grocery & supermarkets operators want to know.
Checkout queues that build faster than staff can react
Queues at the registers form quickly during evening and weekend peaks. Without a measured view of queue length and wait time, managers open lanes by guesswork, and shoppers abandon full baskets when the wait grows too long.
Staffing that does not match the footfall curve
A grocery store's busiest hours shift across the week. When rotas are built on intuition rather than counted arrivals, shifts are overstaffed in quiet periods and stretched thin exactly when shoppers arrive in numbers.
Aisles and departments that are hard to compare
Sales data shows what sold, not how many people passed a department or slowed at a fixture. Managers need to know which aisles draw traffic and which are quietly bypassed before they rework layout or ranging.
End-cap and promotion impact that goes unmeasured
Promotional end-caps are prime real estate, yet their pulling power is usually judged on sales alone. Without traffic and dwell data for that location, it is unclear whether a display drew shoppers or simply sat in a busy lane.
CountPort analytics, applied to grocery & supermarkets.
Each measure runs on the overhead cameras you already have. Video is processed on-site and stays anonymous.
Open checkout lanes on measured demand
CountPort reports queue length, wait time and abandonment at the registers and service counters. Managers can set thresholds for opening additional lanes, so staffing at the front end follows real pressure rather than a backlog that shoppers have already noticed.
Queue ›Match rotas to the footfall curve
Hourly and daily visitor counts show when shoppers actually arrive across the week. Grocery managers can align cashier and floor cover to those patterns, reducing idle hours in quiet periods and thin cover during the genuine peaks.
Counting ›Compare aisle and department traffic
Zones and routes measure how many shoppers reach each aisle or department and the paths they take through the store. That makes it possible to compare a chilled aisle against ambient grocery and to see which routes feed the busiest fixtures.
Zones & routes ›See where shoppers gather and slow down
Heatmaps show the spots on the floor where shoppers pause, cluster or stall, including around promotional end-caps and seasonal displays. This separates a display that genuinely drew attention from one that simply occupied a high-traffic lane.
Heatmaps ›Manage occupancy and capacity
Occupancy analytics report how many people are inside at any moment, with capacity limits and alerts. For larger format stores this supports comfort, safety and orderly flow during the busiest trading hours and seasonal surges.
Occupancy ›Keep staff out of the visitor numbers
Staff exclusion removes employees, shelf-stackers and cashiers from the counts, so footfall reflects shoppers only. This is the single person-level filter CountPort applies, and it keeps conversion and traffic figures honest.
Staff exclusion ›How CountPort works inside a supermarket
CountPort runs on the overhead cameras a grocery store already has at entrances, over the checkouts and across the sales floor. Each feed is read by a small computer kept on the premises, which converts the images into counts, queue measurements and movement patterns. The dashboard then shows footfall by hour, occupancy through the day, queue behaviour at the front end and traffic by aisle or zone.
Because the analysis happens at the store, the figures stay close to the people who use them. Counting separates adults from children and records couples and families as the correct number of shoppers, so a family of four reads as four rather than one. Staff exclusion keeps employees out of the totals. The result is a grocery footfall picture that managers can act on without waiting for a central report.
Results are available live and through scheduled exports or a direct data connection, which lets a store feed counts into existing rota, labour or reporting tools. A single store and a multi-site grocery estate use the same dashboard, so head office can compare locations on the same definitions of footfall, occupancy and queue.
Privacy on the cameras a store already owns
Grocery environments are sensitive about shopper privacy, and CountPort is built to respect that. All video is processed on-site, the footage never leaves the building, and only anonymous numbers are sent to the dashboard. CountPort does not use facial recognition and does not identify individuals, so the system measures behaviour in aggregate rather than tracking any named person.
Visitor profiles describe the anonymous mix of shoppers and how visit patterns change over time, never an identity. A store can see how its weekday and weekend traffic differ, or how the adult-and-child mix shifts across the day, without ever holding personal data. This keeps supermarket analytics straightforward to explain to customers, staff representatives and data protection reviewers.
Using existing cameras also keeps the footprint small. There are no body-worn sensors, no turnstiles and no app for shoppers to install. CountPort reads the same overhead views that already cover the entrance and tills, which is why a grocery store can begin measuring footfall without changing the shopping experience at all.
Getting started and what it costs
Pricing is published and flat per camera, with no bespoke quote required. The Lite plan is 29 dollars per camera per month and the Pro plan is 39 dollars per camera per month, so a grocery store can estimate the cost from the number of cameras it wants to analyse. A typical start point is the entrance and the checkout area, with aisle cameras added as the store extends into zone and heatmap reporting.
A practical rollout begins with counting at the doors and queue analytics at the registers, since those drive the most immediate staffing and service decisions. Aisle and department zones, routes and heatmaps then build a fuller view of how shoppers move and where promotional end-caps earn their space. To see the dashboard against a real store layout, request a demo, or view pricing to plan a per-camera rollout across one site or a wider grocery estate.
The numbers worth watching.
Hourly footfall
Shopper arrivals by hour and day, the basis for matching cashier and floor cover to real demand.
Checkout queue length
How many shoppers are waiting at the registers, used to trigger opening additional lanes before queues grow.
Average wait time
How long shoppers wait at checkouts and service counters, a direct measure of front-end service pressure.
Queue abandonment
Shoppers who leave a queue before being served, signalling lost baskets at the busiest trading periods.
Store occupancy
How many people are inside at once, supporting capacity limits, comfort and orderly flow during peaks.
Aisle and zone traffic
How many shoppers reach each aisle, department or end-cap, used to compare layout and promotional placement.
CountPort measures people anonymously. It counts and groups visitors, never identities, and does not use facial recognition. All video is processed on-site, inside your premises, and is never uploaded; only the measurements you choose to keep are shared. This approach reduces privacy risk and simplifies data-protection review. Read privacy details ›
Explore other industries
All industries ›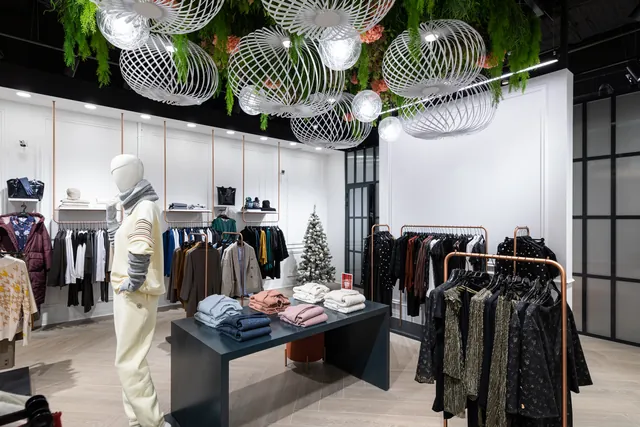
Fashion & Apparel
CountPort measures footfall, conversion and floor behaviour in clothing stores and boutiques using the overhead cameras already installed, with all video processed on-site and no facial recognition.
View ›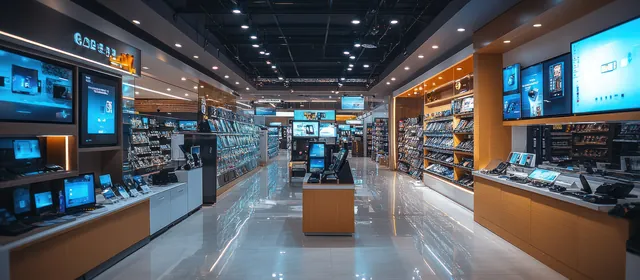
Electronics & Big-Box
CountPort turns the overhead cameras already installed in an electronics or big-box store into anonymous footfall and behaviour analytics, measuring how departments fill, where demo stations draw attention and how many big-ticket visits reach a counter.
View ›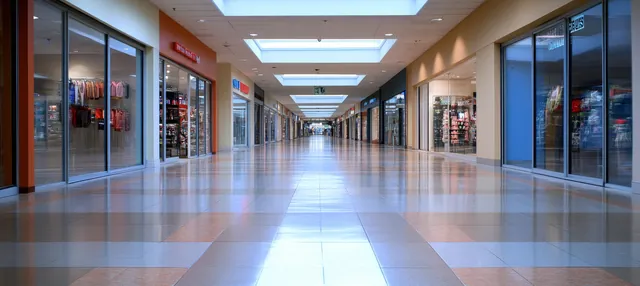
Department Stores
CountPort turns the overhead cameras a department store already operates into footfall and behaviour analytics, measuring each entrance, every floor and individual concessions without new hardware.
View ›Questions about CountPort for grocery & supermarkets.
How does CountPort count shoppers in a supermarket?
CountPort reads the overhead cameras already installed at entrances and across the floor. A small on-site computer converts each feed into counts, separating adults from children and recording groups such as families as the correct number of people. Only the resulting anonymous numbers reach the dashboard.
Does CountPort use facial recognition or identify shoppers?
No. CountPort does not use facial recognition and does not identify individuals. All video is processed on a computer inside the store, the footage never leaves the building, and the dashboard receives only aggregate numbers. The analytics describe behaviour in total, never a named person.
Can CountPort help manage checkout queues?
Yes. Queue analytics report queue length, wait time and abandonment at the registers and service counters. Managers can set thresholds for opening more lanes, so front-end staffing follows measured pressure rather than a backlog shoppers have already felt.
Does CountPort count staff as shoppers?
No. Staff exclusion keeps employees, shelf-stackers and cashiers out of the visitor totals, so footfall reflects shoppers only. This is the one person-level filter CountPort applies, and it keeps traffic and conversion figures accurate.
Do we need to buy new cameras or sensors?
No. CountPort runs on the standard overhead cameras a grocery store already owns. There is no new hardware to install, no turnstiles and no shopper app. The platform reads existing entrance and checkout views and reports results to a live dashboard and scheduled exports.
How much does CountPort cost for a grocery store?
Pricing is published and flat per camera. The Lite plan is 29 dollars per camera per month and the Pro plan is 39 dollars per camera per month. A store can estimate cost from the number of cameras it wants analysed and add aisle cameras as it extends reporting.
See CountPort against your store layout
Request a demo to view footfall, queue and aisle analytics on your own cameras, or view pricing to plan a per-camera rollout.