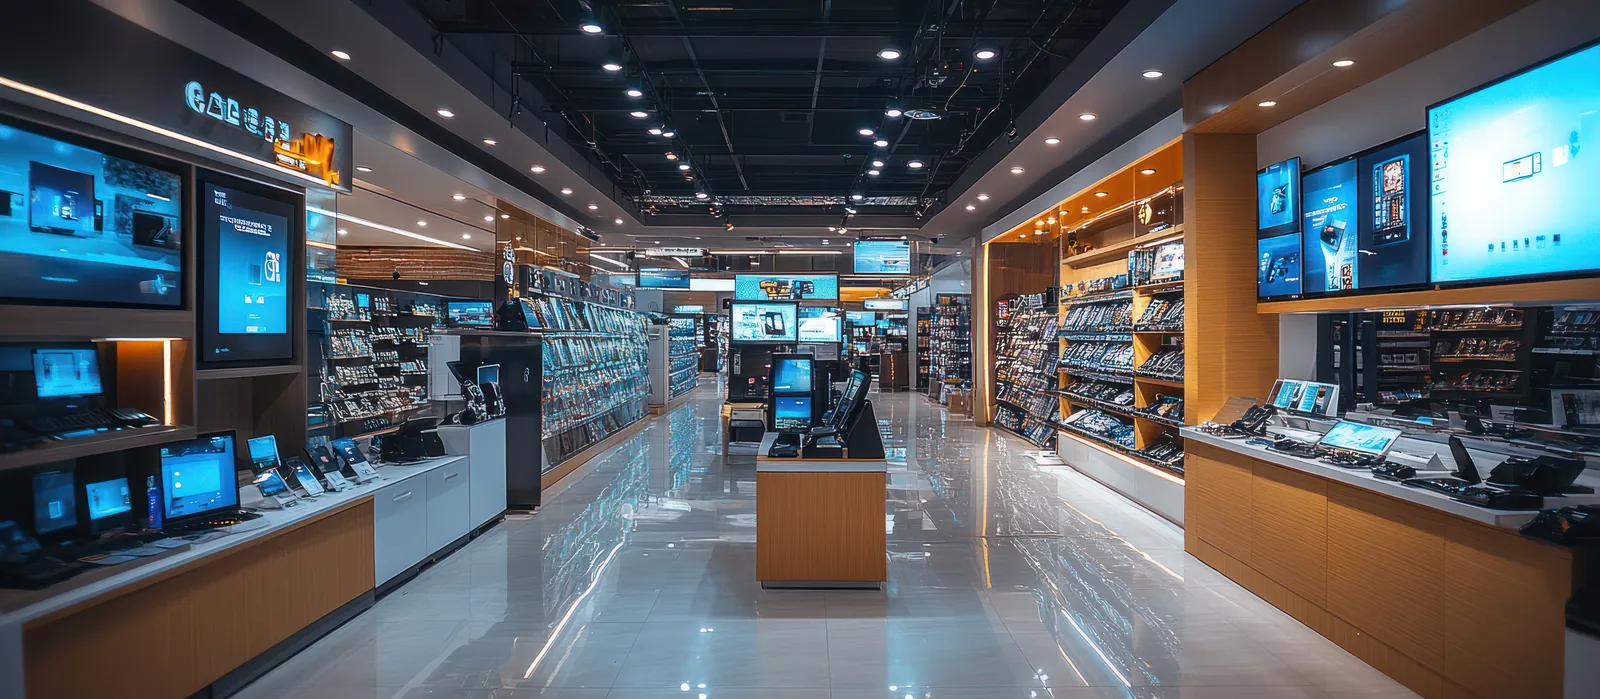
People Counting and Footfall Analytics for Electronics & Big-Box Stores
CountPort turns the overhead cameras already installed in an electronics or big-box store into anonymous footfall and behaviour analytics, measuring how departments fill, where demo stations draw attention and how many big-ticket visits reach a counter.
Works with the cameras you already have · Anonymous · Video stays on-site
Footfall analytics built for high-value retail floors
Electronics and big-box stores carry expensive stock across large, multi-department floors, yet most decisions about staffing, demo placement and layout still rest on sales receipts alone. People counting for electronics and big-box stores adds the missing layer: how many visitors entered, which departments they walked into and how long they stayed before a purchase was recorded.
CountPort is people-counting and visitor-analytics software that runs on the standard overhead cameras a store already owns. All video is processed on-site, never leaves the building, and only anonymous numbers reach the dashboard. There is no facial recognition and no attempt to identify anyone, so the store gains big-box store footfall analytics without adding hardware or handling personal data.
Because the product reports counts, dwell, occupancy and queues rather than identities, managers can compare a high-margin appliance aisle against a phone wall, test where a demo table belongs, and check whether staff coverage matches the busiest hours of the floor.
What electronics & big-box operators want to know.
Long dwell, slow decisions
Shoppers comparing a television, laptop or appliance can linger for many minutes before deciding. Without department dwell time measurement, a store cannot tell considered interest apart from a passing glance, or judge which categories hold attention.
Demo stations with no read on attention
Demo tables and interactive displays are costly to build and staff, yet their effect is usually guessed. Stores rarely know how many visitors actually approached a demo zone, how long they stayed, or which stations pull people in.
Staff coverage across a large floor
Big-box floors span many departments and a few staffed counters. When advisers cluster in one area while another fills with waiting visitors, sales on high-value items are lost. Coverage decisions need an honest view of where and when people gather.
Big tickets that never reach a counter
A visitor may study a product at length and still leave without speaking to anyone or joining a queue. Receipts show the sales that happened, not the high-intent visits that quietly walked out unconverted.
CountPort analytics, applied to electronics & big-box.
Each measure runs on the overhead cameras you already have. Video is processed on-site and stays anonymous.
Measure true visits, not transactions
CountPort counts people entering and leaving from overhead cameras, classifies adults and children, and counts couples and families as the correct number of people. That gives a real denominator for big-box store footfall analytics rather than till counts alone.
Counting ›See which departments hold attention
Heatmaps show where visitors move, slow down and gather across the floor, so a store can tell whether the appliance aisle, phone wall or gaming corner is genuinely drawing dwell, and where attention thins out.
Heatmaps ›Test demo-station placement
Zones and routes report the performance of specific areas and the paths people take, letting a store measure how many visitors reach a demo table, how long they stay, and whether a new station shifts foot traffic the way it was intended to.
Zones & routes ›Match staff coverage to the floor
Occupancy analytics report how many people are inside at once, with capacity limits and alerts, so shift planning and floor coverage can follow the hours when the store and its high-value departments are actually busy.
Occupancy ›Cut waits at checkouts and service desks
Queue analytics track queue length, wait time and abandonment at checkouts, click-and-collect and service points, where slow lines on a big-ticket day quietly cost completed sales.
Queue ›Keep visitor numbers honest
Staff exclusion keeps employees out of the visitor counts, so footfall and conversion figures reflect customers and not advisers walking the floor. This is the only person-level filtering CountPort applies.
Staff exclusion ›How CountPort works inside an electronics or big-box store
Overhead cameras at the entrance, over key departments and above service points feed into a small computer placed inside the store. That computer detects people as anonymous shapes and produces numbers: visits, dwell, journeys, occupancy and queues. No new cameras are required and no images are sent anywhere.
Entrance cameras establish the visitor count and feed staff exclusion. Cameras over the appliance, computing or phone areas support heatmaps and zone reporting, while cameras above checkouts and the service desk drive queue analytics. Each camera is billed at a flat published rate, so a store can start with priority departments and extend coverage later.
Results arrive on a live dashboard, with scheduled exports and a data connection for stores that want footfall figures inside their own reporting. A manager can compare departments day to day, while a regional team can line up several stores against the same anonymous measures of visits, dwell and conversion.
Privacy on the cameras you already run
CountPort processes video on-site and reports only numbers. The footage never leaves the premises, and the product does not use facial recognition or identify individuals. Visitor profiles describe the anonymous visitor mix and how visit patterns change over time, never a person. For a retailer holding high-value stock, this keeps analytics separate from any security or identification system.
Because the analytics are anonymous and built on existing infrastructure, an electronics or big-box store can measure department dwell, demo engagement and queues without taking on the obligations that come with storing or recognising personal data. The numbers describe how the floor performs, not who walked across it.
The numbers worth watching.
Visitor count
How many people entered, counted from overhead cameras with adults, children and groups counted correctly.
Department dwell time
How long visitors linger in an appliance, computing or phone zone, separating considered interest from a quick pass.
Demo zone engagement
How many visitors reach a demo station and how long they stay, measured per area rather than guessed.
Peak occupancy
How many people are inside at once, so staff coverage and capacity alerts follow the busiest parts of the day.
Queue wait and abandonment
Wait times and walk-aways at checkouts and service desks, where slow lines lose completed big-ticket sales.
Visit-to-sale conversion
Counted visits set against recorded sales, giving an honest conversion read for high-value departments.
CountPort measures people anonymously. It counts and groups visitors, never identities, and does not use facial recognition. All video is processed on-site, inside your premises, and is never uploaded; only the measurements you choose to keep are shared. This approach reduces privacy risk and simplifies data-protection review. Read privacy details ›
Explore other industries
All industries ›
Fashion & Apparel
CountPort measures footfall, conversion and floor behaviour in clothing stores and boutiques using the overhead cameras already installed, with all video processed on-site and no facial recognition.
View ›
Grocery & Supermarkets
CountPort turns the overhead cameras a grocery store already runs into footfall, queue and aisle analytics. Video is processed on-site, and only anonymous numbers reach the dashboard.
View ›
Department Stores
CountPort turns the overhead cameras a department store already operates into footfall and behaviour analytics, measuring each entrance, every floor and individual concessions without new hardware.
View ›Questions about CountPort for electronics & big-box.
How does CountPort measure conversion in an electronics store?
CountPort provides the visitor count from overhead cameras, with staff excluded. Set against the store's own sales records for the same period, that count gives a conversion rate for the floor or a department. CountPort supplies the visit figure; the sales figure comes from the till system.
Can it tell which demo stations draw the most attention?
Yes. Using zones and routes together with heatmaps, CountPort reports how many visitors reach a defined demo area, how long they stay and the paths they take to get there, so a store can compare stations and test new placements.
Does CountPort identify shoppers or use facial recognition?
No. CountPort does not use facial recognition and does not identify individuals. People are detected as anonymous shapes, video is processed on-site and never leaves the building, and only counts and behaviour numbers reach the dashboard.
Do we need to install new cameras across the store?
No. CountPort runs on the standard overhead cameras a store already owns. A small on-site computer turns those feeds into analytics. Coverage can start with priority departments and entrances, then extend to more cameras over time.
How is CountPort priced for a large store?
Pricing is published and flat per camera. Lite is 29 dollars per camera per month and Pro is 39 dollars per camera per month, so a big-box store can budget by the number of cameras it connects. View pricing for the full breakdown.
Can it count families and couples correctly?
Yes. CountPort counts groups such as couples and families as the correct number of people and classifies adults and children, which matters on a floor where shoppers often arrive together to choose a high-value item.
See your store floor in numbers
Request a demo to see CountPort measure department dwell, demo engagement and big-ticket conversion on your existing cameras, or view pricing for flat per-camera rates.