People Counting for Libraries and Public Buildings
CountPort turns the overhead cameras a library or civic building already runs into anonymous visitor counts, zone usage and live occupancy. The video stays on-site, and only the numbers reach the dashboard.
Works with the cameras you already have · Anonymous · Video stays on-site
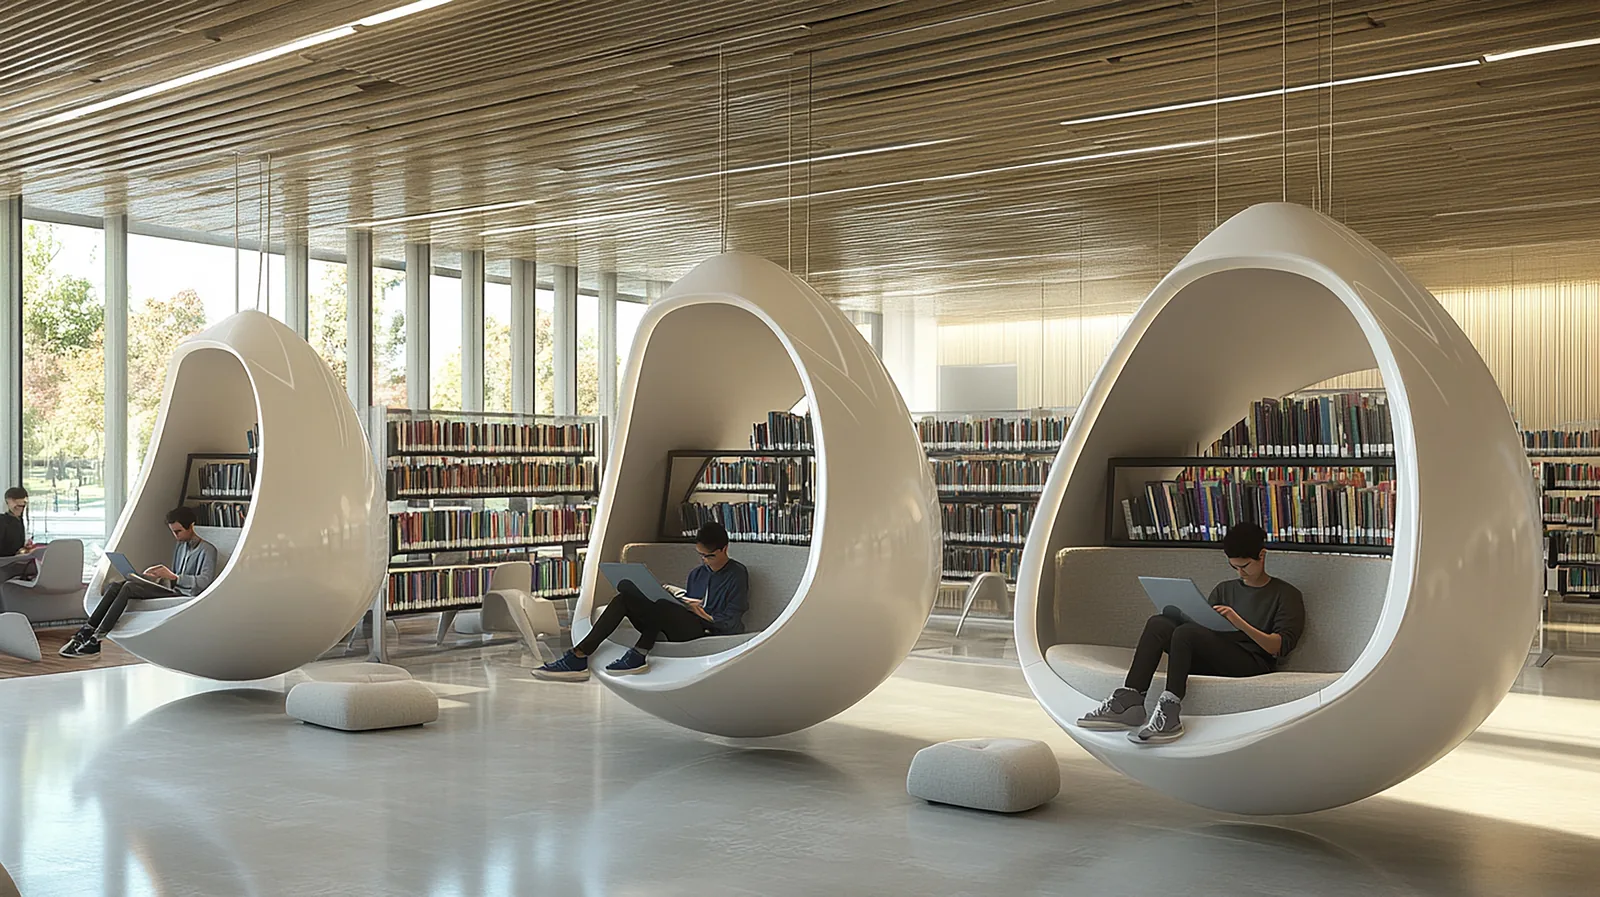
Visitor analytics for libraries and civic spaces, measured anonymously
Public libraries and civic buildings are judged on how much they are used, yet many still report attendance from manual tallies, gate clickers or rough estimates. People counting for libraries replaces those methods with a consistent record of how many visitors enter and leave each day, drawn from the overhead cameras already installed at the entrance.
CountPort is library visitor counting software that processes camera feeds on a small computer inside the building. No images are sent anywhere, no faces are stored, and no individual is identified. The dashboard reports footfall, zone usage and occupancy as numbers and charts, giving the figures needed for funding submissions, usage statistics and opening-hours decisions.
Because CountPort works with existing cameras and adds no new hardware, a single deployment can cover the entrance, the children's area, the study floor and the public-computer zone. Staff exclusion keeps librarians and shelving teams out of the visitor totals, so reported numbers reflect the public, not the people running the service.
What libraries & public buildings operators want to know.
Attendance reporting that funders trust
Grant and budget submissions ask for visitor numbers, but manual counts and gate clickers are inconsistent and easy to question. A library needs a steady, auditable record of footfall it can put in front of a council or trust without caveats.
Knowing which spaces are actually used
A library is many rooms at once: study desks, the children's corner, the public computers, quiet reading. Without zone-level data it is hard to say which areas justify their floor space, staffing and stock, or which sit empty for much of the week.
Setting opening hours against real demand
Extending or trimming hours is a costly decision usually made on assumption. Libraries rarely have hour-by-hour and day-by-day visitor patterns to show when the building is genuinely busy and when it is close to empty.
Counting fairly without surveillance
Public bodies are rightly cautious about cameras that watch individuals. Any counting method has to measure usage anonymously, keep video inside the building, and avoid facial recognition or anything that identifies a visitor.
CountPort analytics, applied to libraries & public buildings.
Each measure runs on the overhead cameras you already have. Video is processed on-site and stays anonymous.
Defensible visitor numbers for funding reports
CountPort counts people entering and leaving from overhead cameras, separating adults and children and counting families as the correct number of people. The result is a consistent attendance record suitable for funding and annual usage statistics.
Counting ›See which zones earn their space
Zone and route analytics show how the study floor, children's area and computer suite are used and how visitors move between them, so floor space, stock and staffing can follow real demand rather than assumption.
Zones & routes ›Set opening hours on real patterns
Footfall by hour and by day shows when the building is busy and when it is nearly empty. That evidence supports decisions to extend, trim or reallocate opening hours and weekend staffing.
Counting ›Manage occupancy and capacity
Occupancy analytics report how many people are inside at one time, with capacity limits and alerts. This helps during busy events, exam periods or any time a civic building must respect a stated capacity.
Occupancy ›Find where readers gather and where they pass through
Heatmaps show where visitors slow down, settle and congregate on the floor. A library can see which shelves, displays and seating draw people and which corners are quietly ignored.
Heatmaps ›Report the public, not the staff
Staff exclusion keeps librarians, volunteers and shelving teams out of the visitor figures, so attendance statistics reflect genuine public use of the building.
Staff exclusion ›How CountPort works inside a library or civic building
CountPort connects to the overhead cameras already covering the entrance and key zones of the building. A small computer on-site reads those feeds and converts them into counts of people entering and leaving, occupancy at any moment, and movement across defined areas. The original video is never sent off the premises; it is processed locally and discarded, and only the resulting numbers travel to the dashboard.
From there, a library can read live figures or schedule exports. Counts by hour, day and zone support the recurring reports a public service has to produce: attendance for funders, usage by area for stock and staffing reviews, and occupancy records for capacity management. Because nothing depends on new sensors or gates, a branch can begin measuring with the equipment it already owns.
CountPort reports the building it is installed in. It does not de-duplicate visitors across separate cameras or claim that a single person is counted once across the whole site, so figures should be read as zone and entrance counts rather than a unique-visitor total. Staff exclusion is the one person-level filter applied, removing employees from the public numbers.
Privacy on the cameras a public building already runs
Trust matters more for a public institution than for almost any private venue. CountPort is built to count without watching individuals. There is no facial recognition, no identification of any visitor, and no footage leaving the building. All processing happens on a computer inside the premises, and the dashboard only ever shows aggregate numbers and charts.
This anonymous approach lets a library report honest usage statistics while respecting the expectations of the public it serves. A council, library board or facilities team can describe the method plainly: existing overhead cameras, on-site processing, counts and occupancy only, no personal data. The measurement supports planning and funding without turning a reading room into a surveillance space.
Getting started and what it costs
A typical first step is to map which cameras already cover the entrance and the zones worth measuring, then point CountPort at those feeds. Most libraries begin at the front door for a clean attendance count, then add the children's area, study floor and public-computer zone as zone-level questions arise. Results appear on the dashboard with scheduled exports or a data connection for existing reporting.
Pricing is published and flat per camera. Lite is 29 dollars per camera per month and Pro is 39 dollars per camera per month, so a building can budget directly from the number of cameras it wants to use. To see the dashboard against a real library layout, request a demo; to plan a roll-out across branches, view pricing and count the cameras involved.
The numbers worth watching.
Daily visitors
Total people entering, the headline attendance figure for funding submissions and annual usage statistics.
Footfall by hour and day
When the building is busy or near empty, the evidence behind opening-hours and staffing decisions.
Zone usage share
How visits divide across study, children's, reading and computer areas, showing which spaces are used.
Peak occupancy
The highest number of people inside at once, set against any stated capacity for the building.
Adult and child split
The mix of adults and children entering, useful for children's-service and family programming reports.
Dwell and gathering points
Where readers settle and congregate on the floor, drawn from heatmaps of the public areas.
CountPort measures people anonymously. It counts and groups visitors, never identities, and does not use facial recognition. All video is processed on-site, inside your premises, and is never uploaded; only the measurements you choose to keep are shared. This approach reduces privacy risk and simplifies data-protection review. Read privacy details ›
Explore other industries
All industries ›
Museums & Galleries
CountPort turns the overhead cameras a museum or gallery already owns into anonymous visitor numbers, gallery dwell figures and room occupancy, ready for daily operations and funder reporting.
View ›
Fashion & Apparel
CountPort measures footfall, conversion and floor behaviour in clothing stores and boutiques using the overhead cameras already installed, with all video processed on-site and no facial recognition.
View ›
Grocery & Supermarkets
CountPort turns the overhead cameras a grocery store already runs into footfall, queue and aisle analytics. Video is processed on-site, and only anonymous numbers reach the dashboard.
View ›Questions about CountPort for libraries & public buildings.
Does CountPort use facial recognition to count library visitors?
No. CountPort does not use facial recognition and does not identify anyone. It counts people anonymously from overhead cameras. The video is processed on a computer inside the building and is never sent elsewhere, and only the resulting numbers reach the dashboard.
Do we need to install new hardware or sensors?
No. CountPort works with the overhead cameras a library or civic building already has. A small on-site computer reads those feeds. There are no new gates, counters or door sensors to fit, which keeps installation light for a public-sector budget.
Can it separate staff from members of the public in the counts?
Yes. Staff exclusion keeps librarians, volunteers and shelving teams out of the visitor totals, so the attendance figures you report reflect genuine public use of the building rather than the people running the service.
Can CountPort measure how different areas of the library are used?
Yes. Zone and route analytics report usage of specific areas such as the study floor, children's corner and public-computer suite, and the paths visitors take between them. Heatmaps add where people slow down and gather on the floor.
How does the data help with funding and opening hours?
CountPort provides consistent visitor counts by hour, day and zone, plus occupancy figures. These give defensible attendance numbers for funding submissions and clear demand patterns to support decisions about extending, trimming or reallocating opening hours.
Does CountPort count each visitor only once across all cameras?
No. CountPort reports counts per entrance and per zone and does not de-duplicate the same person across separate cameras. Figures should be read as entrance and zone counts. Staff exclusion is the only person-level filter it applies.
See visitor numbers for your library, anonymously
Request a demo to view the dashboard against a real library layout, or view pricing to budget by the cameras you already run.